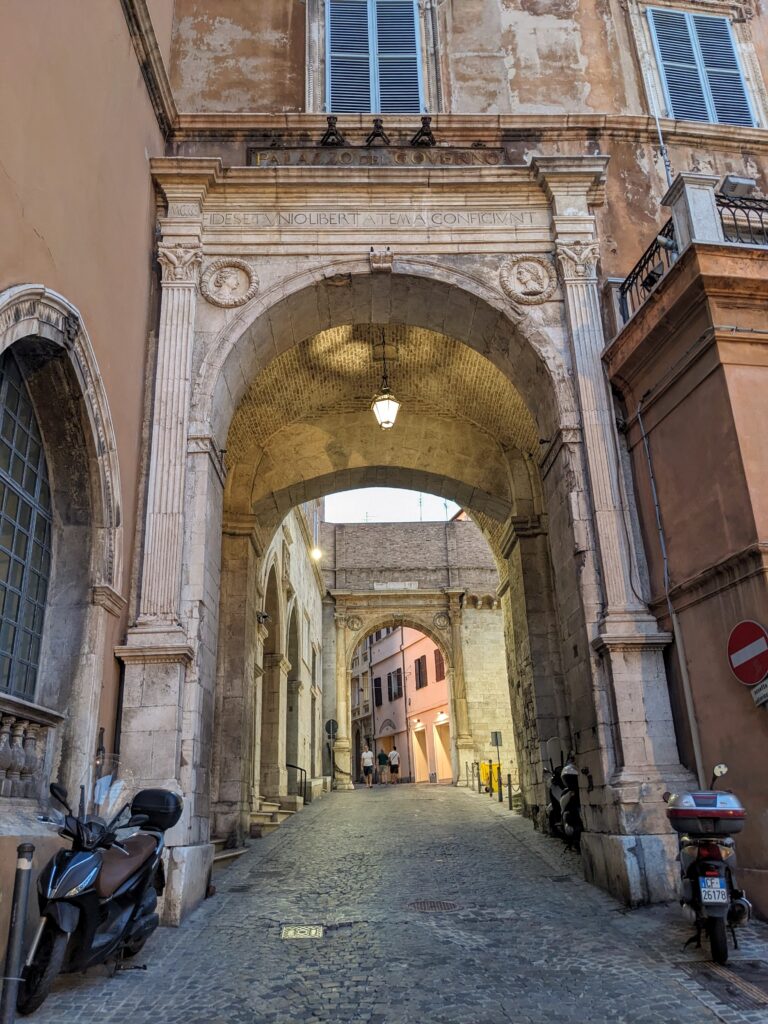
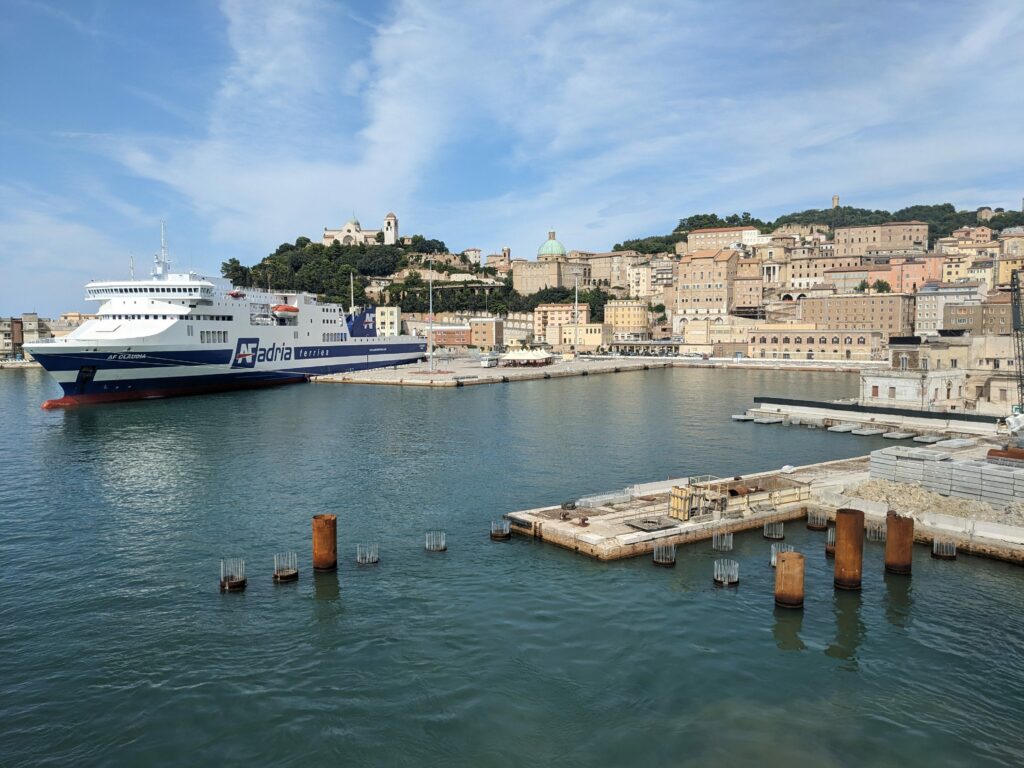
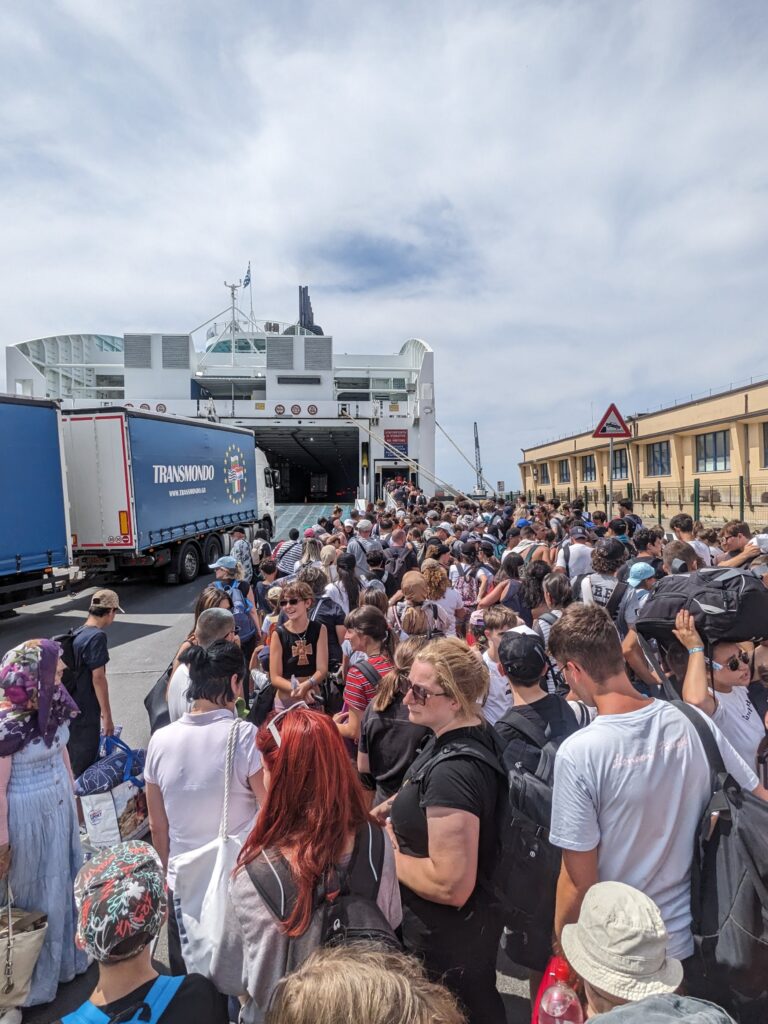
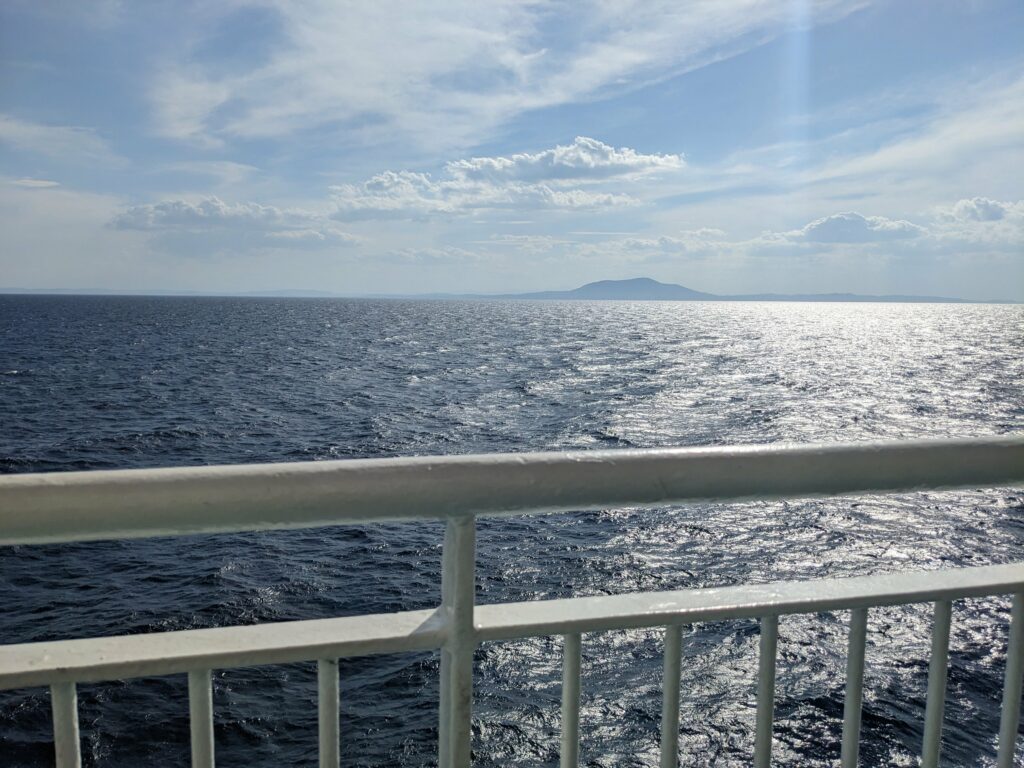
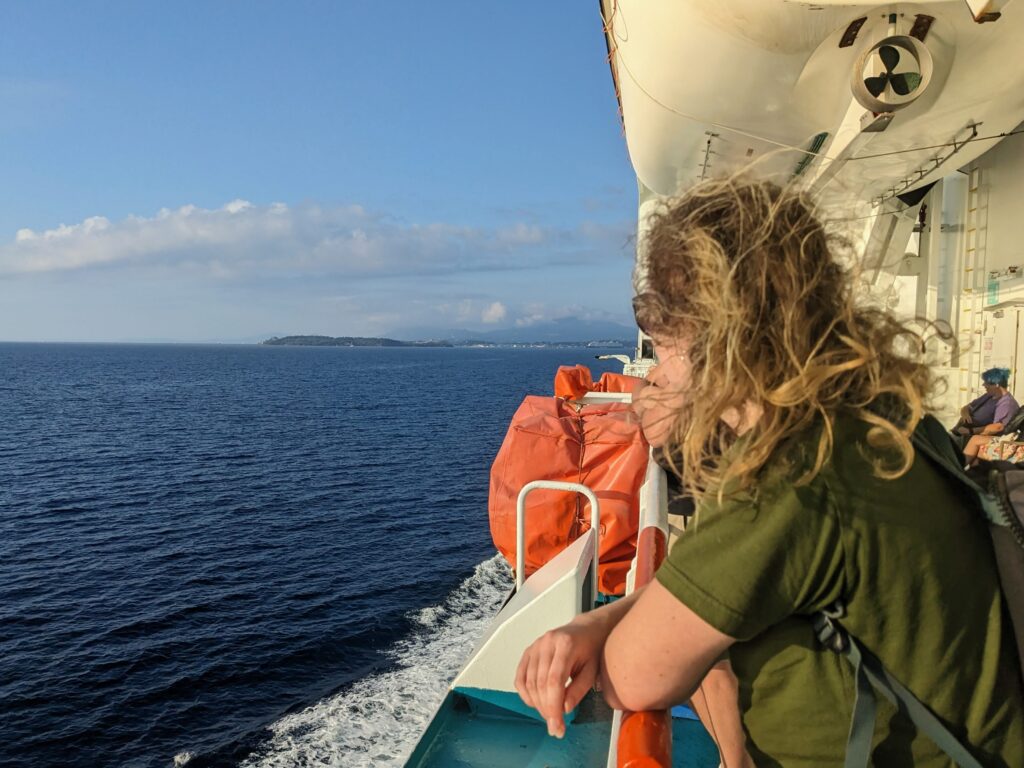
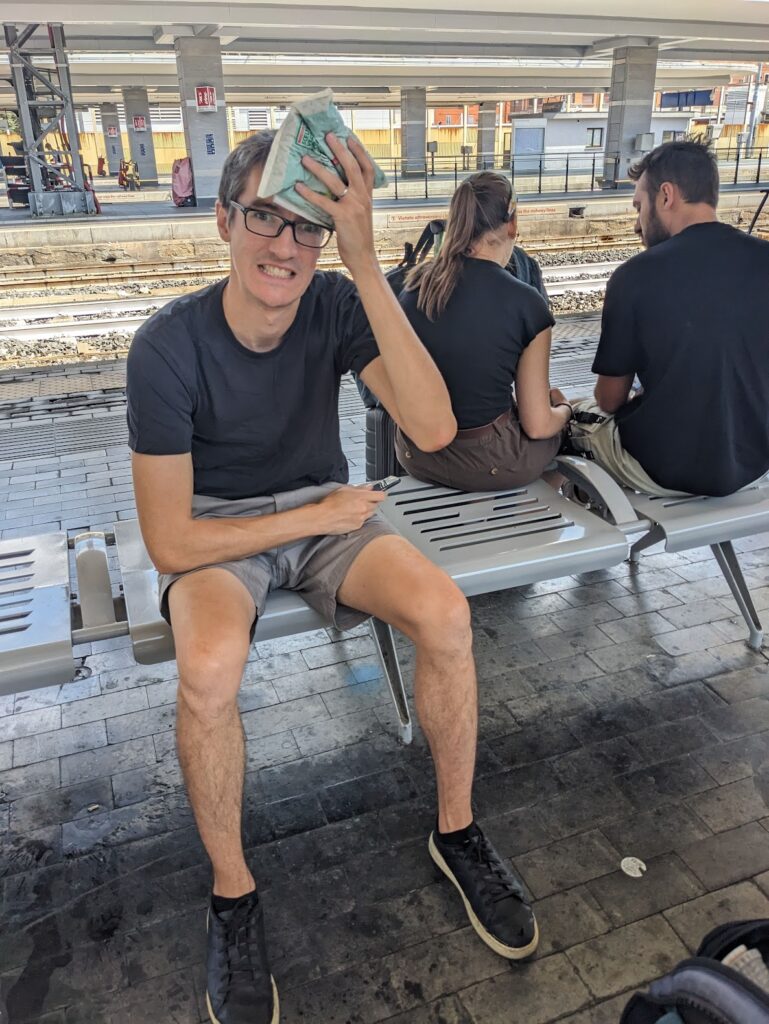
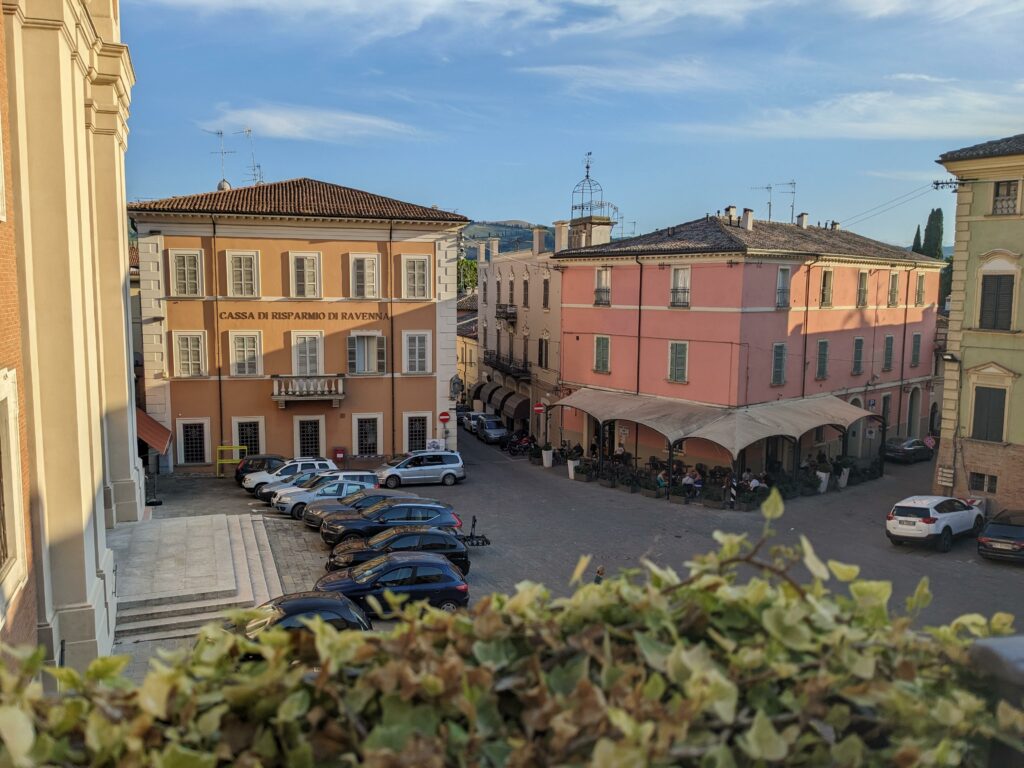
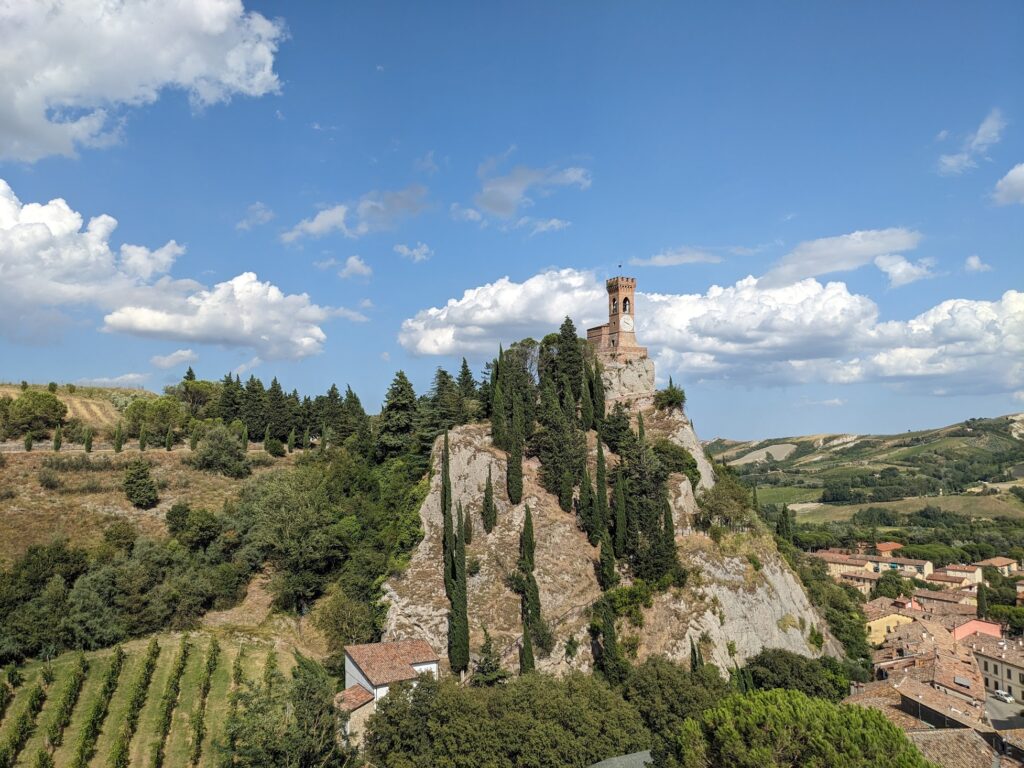
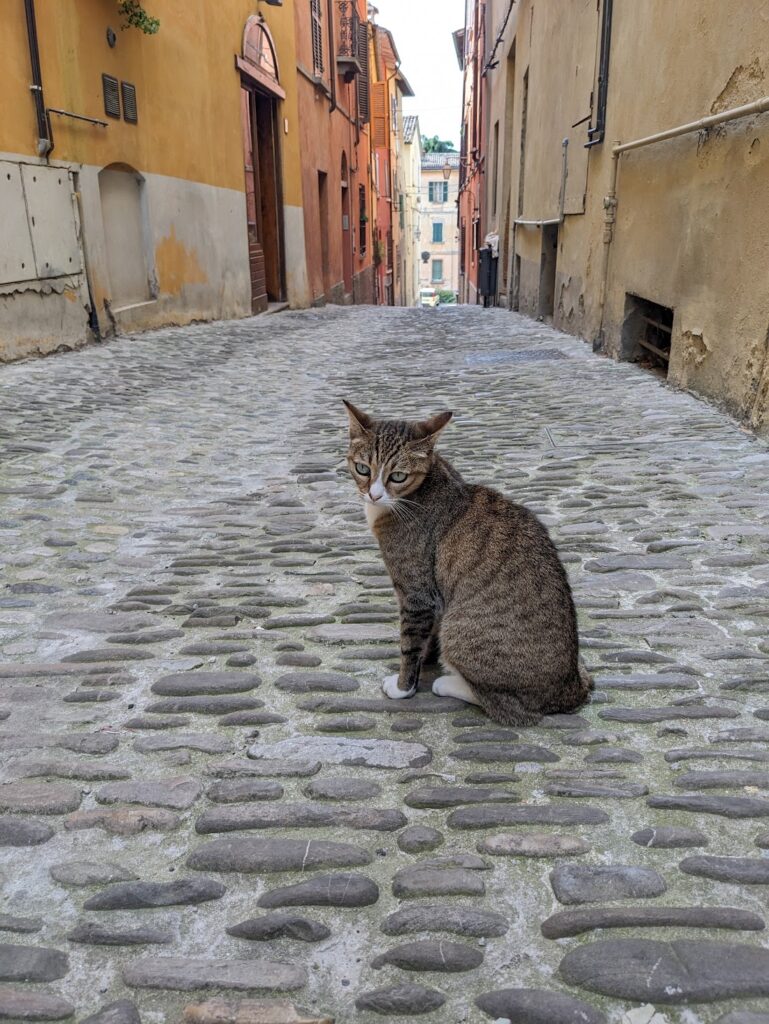
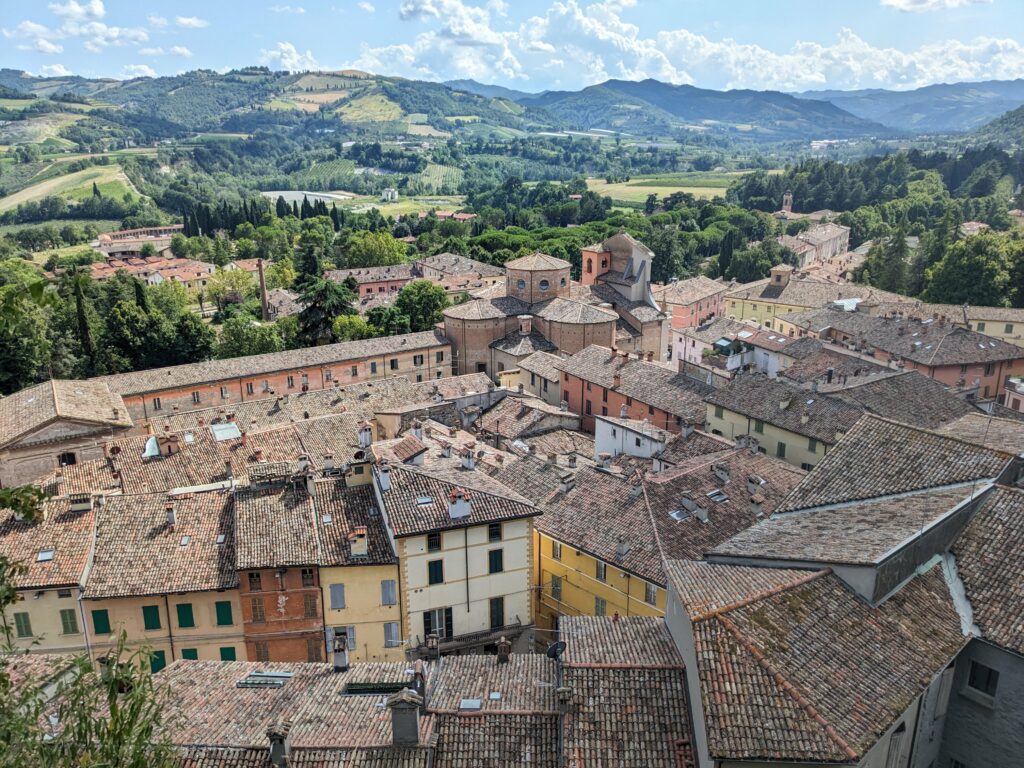
After landing in Lisbon, we travelled 2,825 km over land to reach the port of Ancona. In Spain, we scaled two cathedrals for the price of one in Salamanca and gorged on tapas in Zaragoza, before walking the medieval walls of Girona. In France, we soaked up the atmosphere of Place Royal du Peyrou in Montpellier and sampled a Calisson (or two) in Aix-en-Provence. Finally, in Italy we ate our way through everything Parma had to offer, gawked at some expensive red cars in Maranello, slurped on Tagliatelle al Ragù in Bologna, and explored the gorgeous cobbled streets of Brisighella.
We’d planned our route through southwestern Europe around convenient long-distance train and bus routes. Although these routes tend to connect large cities (like Madrid, Barcelona, Marseille and Nice), we generally passed straight through them in order to leave more time to visit smaller cities and towns. This seemed to give us the best of both worlds, in that many of our stops felt slightly off the beaten track without actually being too time consuming to reach.
Carbon 🚆
Our flight from New York to Lisbon was responsible for 91% of our carbon emissions from this leg of the journey, which is understandable since we did travel further in the air than we did by land.
We normally allocate carbon emissions from international travel to the arrival country, but this didn’t seem very fair on poor old Portugal since we only stayed in the country for one night before heading east into Spain. Instead, this time we’ve distributed the carbon from our trans-Atlantic journey across Portugal, Spain, France and Italy, proportional to how many nights we stayed in each country.
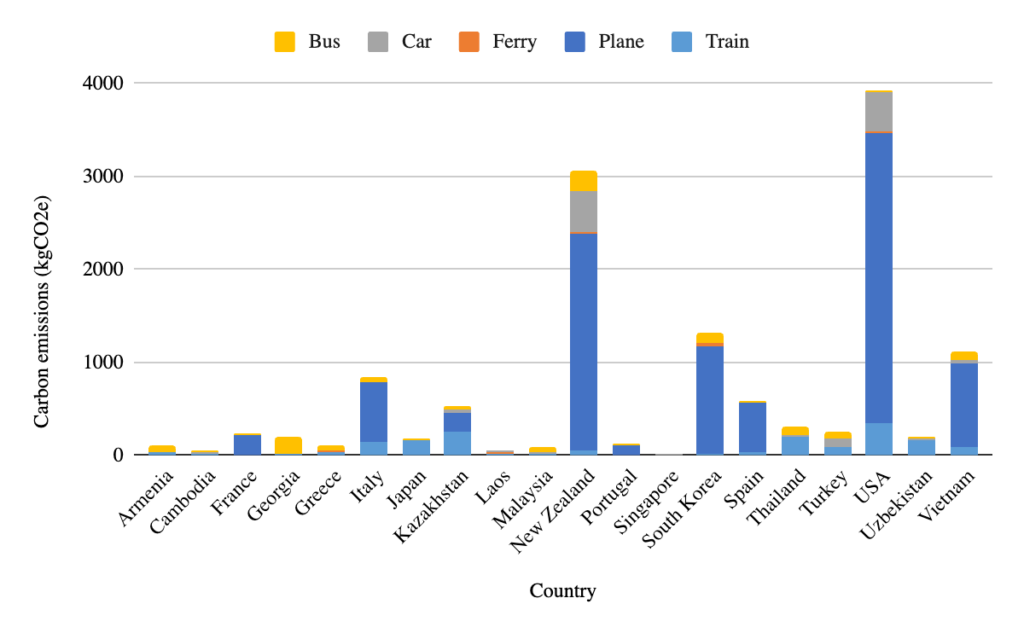
As usual, we’ve offset these emissions through Gold Standard’s Climate+ Portfolio. The offsets from this leg of our journey are helping to fund the construction of a wind farm in Turkey. All of our carbon offsets from the past year are recorded in Gold Standard’s offset registry, along with the various projects that they’ve supported.
Cost 💰
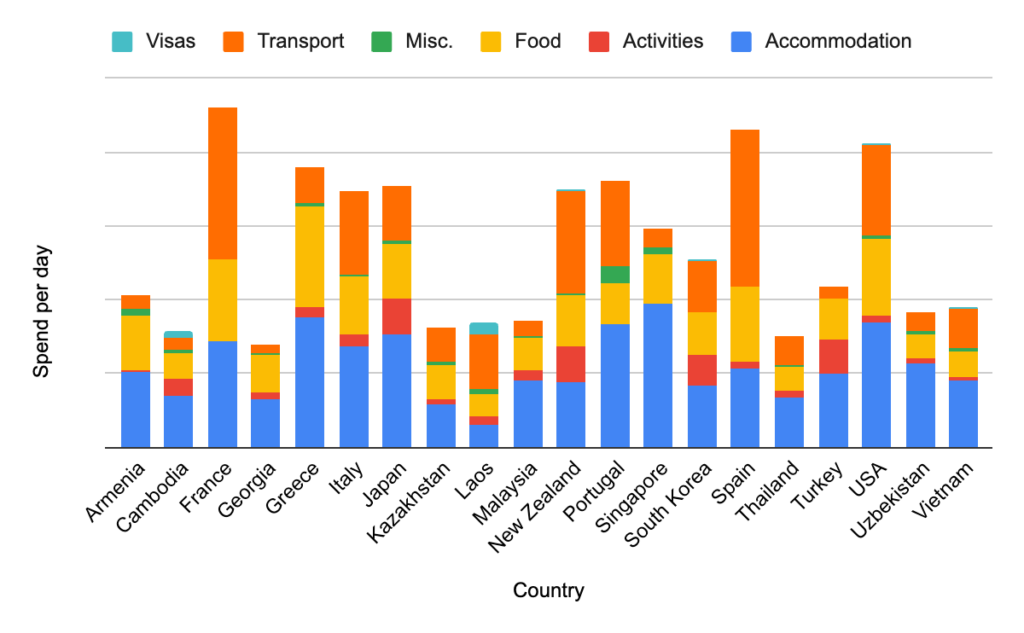
All four countries ranked highly on our spend per day tracker. A key contributor to these totals was our expenditure on transport, since we did travel fairly quickly through these countries (e.g. taking advantage of high-speed rail links). We also distributed the cost of our flight to Lisbon between Portugal, Spain, France and Italy using the same method as for our carbon emissions, which pushed up the transport costs further. In general, though, it felt like we were getting a lot for our money being back in Europe – both food and accommodation was so much cheaper than in the United States.
Cats 🐈
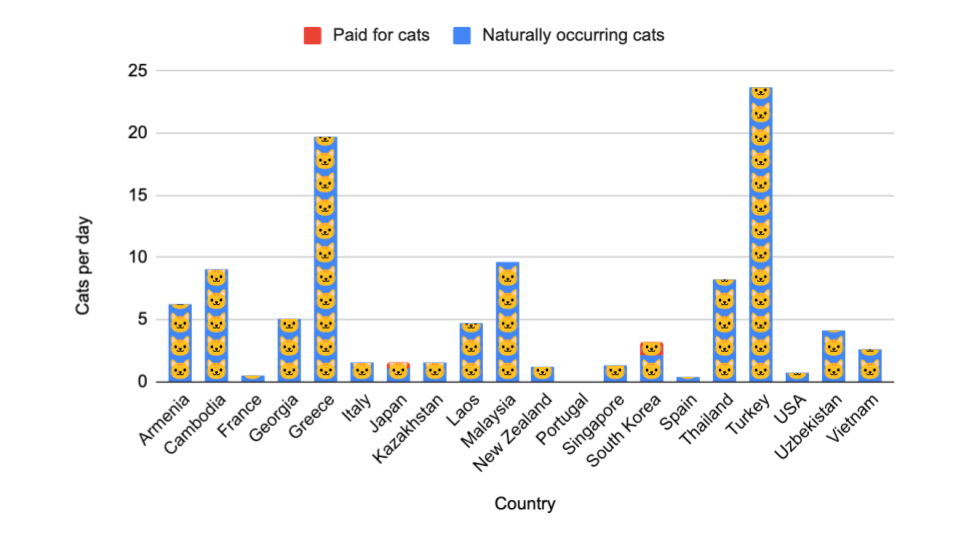
Sadly, the ongoing cat drought continued throughout western Europe, with Portugal receiving the dubious honour of being the first totally cat-free country of our trip so far.
As with the graphs above, Italy’s total reflects the average cats per day across both of our visits to Italy, because let’s face it, people need to know a country’s cat density before planning their next holiday.
🏅Snappiest dresser
It’s no secret that the Italians are a well-dressed bunch, but this black eyeliner, white neckerchief and socks combo blew les chats français out of the water.

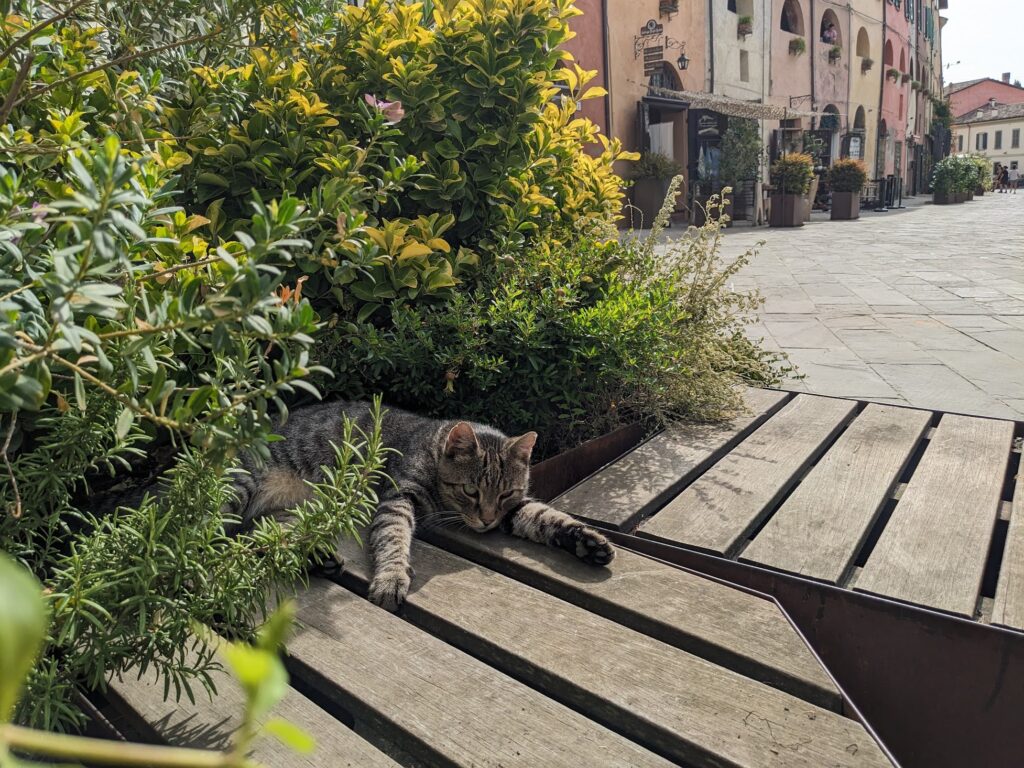
🏅Most photogenic spot for a nap
This is already the third photo of Brisighella’s cats to feature on this blog, and we haven’t even started to scrape the barrel. What a little poser!
Having spent nearly a year travelling outside of Europe, we felt like we had a newfound appreciation for its beauty and variety, which we’ve definitely taken for granted in the past. The biggest adjustment was actually mealtimes! But given New York is five hours behind Portugal, the jet lag actually worked in our favour when it came to typical Iberian mealtimes – with lunch occurring mid-afternoon and dinner some time around 9-11pm! And the food was worth staying up for, anyway…


